Top Stocks YTD › Momentum Investing Guide
Momentum investing: how to use YTD rankings
Momentum is one of the simplest ideas in investing, and one of the strangest: stocks that have risen over recent months have tended to keep rising, and stocks that have fallen have tended to keep lagging. This guide explains what the effect is, how to read the tables on this site with momentum in mind, a simple routine investors use, and the risks that come with the approach. It is education about a method, not a recommendation to buy or sell anything.
What momentum is
In plain terms, prices move in trends more often than they snap back, at least over horizons of a few months. That sounds backwards next to "buy low, sell high", but it is what the data has shown for a long time. Narasimhan Jegadeesh and Sheridan Titman documented the effect in 1993: portfolios of recent winners beat portfolios of recent losers in US stock data going back decades. Researchers have since found versions of the same pattern in other countries, other decades, and other asset classes, which is why momentum is often described as one of the most persistent patterns in market data. Explanations differ. Investors may react slowly to news, good news may arrive in installments, and large buyers often build positions over weeks, all of which can keep a trend going longer than expected.
A year-to-date (YTD) return is one way to measure momentum: the change in a stock's price from the start of the year to today. Early in the year that window is short and noisy. By mid year it covers two or three quarters, which sits in the range where momentum has historically been strongest.
How to read these tables for momentum
Start with the leaderboard. The homepage ranking sorts every S&P 500 stock by YTD return. For momentum, the top of the table is a screening list: the names with the strongest sustained demand so far this year. Treat it as a starting point for research, not a finished portfolio.
Check market breadth. The snapshot near the top of the homepage shows how many stocks are up this year and what the median return is. When most stocks are positive and the median is healthy, the trend is broad and momentum signals are usually cleaner. When the index is up but the median stock is down, gains are concentrated in a few large names and momentum lists tend to be more fragile.
Look at sectors. The sectors page ranks all 11 GICS sectors by their average YTD return. Momentum usually clusters: one or two sectors lead for months at a time. Knowing whether a stock's sector is near the top or the bottom of that table tells you how much of the stock's move is its own and how much is the tide.
Compare the stock with its sector. Every stock page on this site shows the stock's YTD return next to its sector average, with the gap in percentage points and a verdict. A stock beating a strong sector average is showing stock-specific strength. A stock that is merely keeping up with a hot sector is mostly a sector bet, which is a different decision.
Use the compare tool. The compare pages put any two stocks head to head on YTD return. When you are choosing between two names, often in the same sector, comparing their lines shows which one has held its trend more steadily rather than in a single spike.
Momentum windows compared
A YTD return is one measuring window among several, and the window you choose changes what you see. Short windows react quickly and mislead often. Long windows are steadier, but slower to admit that a trend has ended. The four windows investors talk about most:
| Window | What it captures | Strength | Weakness |
|---|---|---|---|
| 1 month (about 21 trading days) | The most recent trend: which stocks are moving right now. | Reacts fastest to a new trend or a reversal. | The noisiest window. One earnings week can dominate it, and very short moves often reverse. |
| 3 months (about 63 trading days) | One quarter of price action, roughly one earnings season. | A workable balance of speed and stability; a common building block in momentum research. | Still hostage to a single big event, and slow, steady climbers can be missed. |
| 6 months (about 126 trading days) | Two quarters of performance: the core window of the classic momentum studies. | Long enough to filter out most noise, which is where the effect has been strongest. | Slow to reflect a genuine change in a company's situation. |
| Year to date (January 1 to today) | The calendar year so far; the window this entire site is built on. | Simple and transparent, and by mid year it overlaps the 3 to 6 month range. | Changes character across the year: very short in January, potentially stale by December. |
Practitioners rarely trust a single window. A common approach is to average a stock's ranks across two or three windows, or to require a name to look strong on more than one before it qualifies. A stock that leads the YTD table and also appears near the top of this site's Top of the Month table is showing momentum at two horizons at once, which is a sturdier signal than either one alone.
The classic studies also skipped the most recent month. Jegadeesh and Titman's portfolios were built on returns from months 2 through 12, leaving out the latest month entirely, because the most recent few weeks of a move often reverse. That is one reason a monthly table can carry more signal than a weekly one, and why the Top of the Week table on the homepage is best read as a radar for new names rather than a buy list. Each completed month's final top 25 is preserved in the monthly archive, so you can watch how the leadership group evolved instead of trusting memory.
A simple momentum routine
Investors who use momentum usually keep the routine boring and repeatable:
• Build a watchlist from the top of the table. Star names on the leaderboard to track them on your watchlist. You are looking for strength that persists over weeks, not one big week.
• Confirm the sector. Prefer names whose sector average is also strong, or at least know when you are betting against the sector trend.
• Check how far a name has run. A stock up sharply in a near straight line over a few weeks is extended: the momentum is real, but so is the risk of a sharp pullback. Many momentum investors wait for a pause instead of chasing the steepest part of a move.
• Set a review cadence. Monthly is typical. Momentum is a months-long effect, so checking daily mostly adds noise and temptation.
• Rebalance by strength. At each review, drop names whose momentum has faded, meaning they have slid down the table or fallen behind their sector average, rather than averaging down into weakness. Replace them with current leaders if you want to keep the same overall exposure.
A worked example: reading today's leader
Theory is easier to judge after one concrete pass. The walkthrough below applies the steps above to today's data, using the same figures you can check on the stock's own page. It follows Moderna (MRNA), the stock at the top of the YTD leaderboard as of October 30, 2026. This is an illustration of the process, not a recommendation to buy or sell the stock.
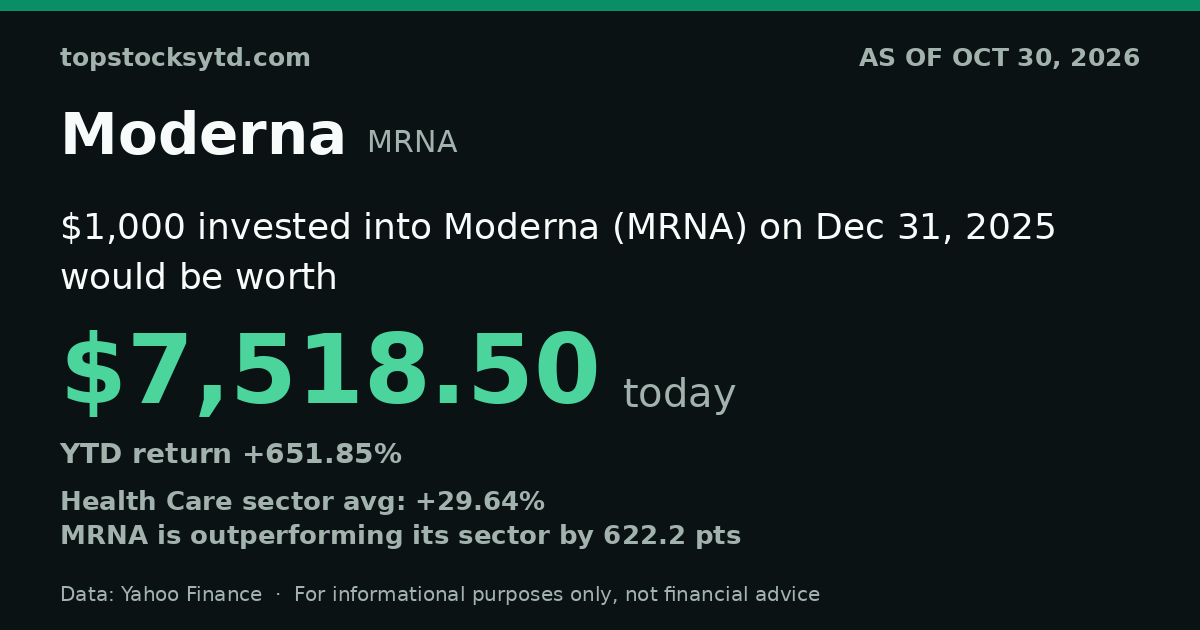
Start with the headline number. Moderna (MRNA) is up +651.85% year to date, ranked number 1 of 500 ranked S&P 500 stocks. $1,000 invested on December 31, 2025 would be worth $7,518.50 today. It leads the number two stock by 267.02 points.
Check the sector behind it. MRNA belongs to the Health Care sector. Across its 60 ranked stocks, the sector average YTD return is +29.64%, which puts Health Care at number 3 of 11 sectors on the sectors page. MRNA is 622.21 points ahead of that average, so the bulk of this lead is stock-specific strength rather than a sector tide: the average Health Care stock is far behind it. Its sector also sits near the top of the sector table, so the trend has confirmation at both levels, the stock and its group.
Check how extended it is. Over the past month MRNA has gained 17.35%, and over the past three months it has gained 302.10%. It trades 9.80% below its 52-week high of $245.81, set on October 21, 2026. In the last five sessions it rose in 3 of them. That is a steadier profile: the trend is advancing without the vertical shape that so often ends in a sharp reversal.
Decide in advance what would break the idea. Following the routine above, the exit conditions for a name like MRNA are written down before any purchase: if at a scheduled monthly review it has fallen behind its sector average, dropped out of the top group on the leaderboard, or its sector has slid into the bottom half of the sector table, the momentum case is materially weaker than it is today. Deciding those conditions now, while the chart looks strong, is what turns a ranking into a process instead of a mood.
Common momentum mistakes
Chasing a vertical run. When a stock has doubled in a few weeks, the easy part of the move has usually already happened, and the steepest segment of a chart is where sharp pullbacks begin. The momentum signal may still be intact, but your entry price decides your experience. On any stock page here, the Recent performance section shows the one-month move next to the longer trend, which makes a vertical month easy to spot before you chase it.
Ignoring whether the sector agrees. A leader in the weakest sector is fighting its own tide: most of its peers are falling, and support for the move is thin. The reverse mistake is just as common, crediting a stock for strength that belongs to its sector. The sector comparison on each stock page, and the ranking on the sectors page, exist to separate the two before you decide which one you are actually buying.
Treating a late-year rank as fresh information. By December, a YTD table describes almost a full year of history. The number one rank is a fact about the past eleven months, not a live signal, and the window resets in January. Practitioners roll their windows forward for exactly this reason. A ranking is a starting point for questions, and the later in the year it is, the more of those questions should be about what happens next.
Averaging down on fading momentum. Adding to a stock because it has become cheaper feels disciplined, but it contradicts the premise of the strategy: in momentum, persistent weakness is information, not a sale. The routine in this guide handles a faded name by replacing it at the scheduled review. Averaging down instead turns one weakening position into the largest thing you own.
Letting one sector become the whole portfolio. Leaders cluster, so a portfolio built from the top of the table in a strong year can end up mostly in one or two sectors without any single decision looking reckless. Then one sector reversal becomes a portfolio event. A simple cap on how much any one sector can represent, checked against the sectors page at each review, keeps a momentum portfolio from quietly becoming a sector fund.
Trading the daily re-ranking. This table changes every day, and small rank changes are mostly noise: a stock does not become a different company because it moved from rank 14 to rank 19 overnight. Checking daily is fine. Trading on daily changes turns a months-long effect into a noise-trading habit, with the costs and taxes to match. The monthly cadence exists because the effect lives at that horizon.
The risks, plainly
Momentum crashes. When a trend reverses sharply, recent leaders can fall fastest because so many holders are positioned the same way. The classic example is the rebound after the 2008 financial crisis, when beaten-down stocks snapped back violently and momentum portfolios lost heavily within months.
Extension late in the year. By November or December, the top of a YTD table is largely a list of stocks that have already run hard. Buying the most extended names late means paying for momentum that may be close to spent.
Silence on value and quality. A YTD rank says nothing about valuation, debt, earnings quality, or whether the underlying business is sound. Some leaders are excellent companies; some are speculative names riding a theme. The ranking cannot tell them apart.
Concentration. Leaders tend to cluster in one or two sectors, so a portfolio built only from the top of the table can quietly become a single sector bet.
Habits that help manage all of this: size positions so that one bad name cannot do real damage, write down exit rules before buying rather than during a drawdown, spread holdings across names and sectors, and keep the review cadence steady instead of reacting to every red day.
What a YTD rank does not tell you
A rank on this site is one measurement: the change in a stock's price since December 31, adjusted for splits and dividends. It does not predict next month, it does not grade the company, and a high rank is not a buy signal by itself. Investors who use a screen like this pair it with their own research on fundamentals and valuation, and with an honest view of their own risk tolerance.
How every figure on this site is calculated, including the sector averages used in the worked example, is documented on the methodology page.
Glossary
- Momentum
- The tendency of assets that have risen over recent months to keep outperforming, and of laggards to keep lagging, over the following months.
- Relative strength
- A stock's performance compared with a benchmark or a peer group rather than on its own. On this site, the sector comparison on each stock page is a relative strength check.
- Breadth
- How widely a market move is shared. Here it is measured by the share of S&P 500 stocks with positive YTD returns and by the median return.
- Sector rotation
- The pattern of market leadership moving between sectors over time, and the strategy of favoring the sectors whose average returns are strongest.
- Extension
- How far and how fast a stock has run in a short period. An extended stock has risen steeply with little pause, which raises the risk of a sharp pullback.
- Drawdown
- The fall from a peak to a later low, usually measured in percent. A stock trading 20% below its high is in a 20% drawdown from that peak.
- Rebalance
- Periodically adjusting a portfolio back to its intended holdings or weights. In a momentum routine, rebalancing means swapping faded names for current leaders on a set schedule.
- Invalidation
- The condition, decided in advance, that would show an investment idea is wrong and trigger an exit, such as a stock falling behind its sector average at a scheduled review.
Momentum investing FAQ
Does momentum investing actually work?
It has worked more often than not in historical data. Studies of US stocks going back many decades, and of markets in dozens of other countries, find that recent winners tended to beat recent losers over the following months. That is an average across long periods, not a promise: momentum has also produced sudden, steep losses, and past performance does not guarantee future results.
How often should you rebalance a momentum portfolio?
Monthly is the most common cadence in both research and practice, because momentum is measured over months and daily changes are mostly noise. Some investors review quarterly instead, to reduce trading costs and taxes. What matters most is choosing a schedule in advance and sticking to it, rather than reacting to every red day.
What is the difference between momentum and growth investing?
Growth investing buys companies whose earnings or revenue are expected to grow quickly, based on fundamentals and forecasts. Momentum buys whatever has already been rising, whatever the reason. The two often overlap, because growing companies frequently have rising share prices, but a momentum screen like this one looks only at price performance and says nothing about the business underneath.
Can you use YTD returns for momentum?
Yes, with caveats. A YTD return is a momentum window that starts on January 1, and by mid year it covers the two to three quarters where momentum has historically been strongest. Early in the year the window is short and noisy, and by December it can be stale, which is why many practitioners blend several windows instead of relying on just one.
What are the biggest risks of momentum investing?
The signature risk is a momentum crash: when a crowded trend reverses, recent leaders can fall faster than the market. Other risks include buying a stock that is already extended after a steep run, concentrating in one hot sector, and running up trading costs through frequent turnover. Position sizing, diversification across names and sectors, and exit rules decided in advance are the standard defenses, and none of them removes the risk entirely.
How many stocks should a momentum portfolio hold?
There is no single right number, but most practical momentum portfolios hold somewhere between 10 and 30 stocks. Below that range, one bad name can dominate your results. Far above it, the portfolio starts to resemble the index while the extra work and trading costs remain. The portfolios in the original research typically held dozens of stocks spread across sectors.
Educational only. This guide is educational only and is not financial advice. Nothing on this page is a recommendation to buy or sell any security. Past performance does not guarantee future results.
For informational purposes only, not financial advice.
Back to the live YTD leaderboard →
About · Contact · Privacy Policy · Affiliate Disclosure · Methodology
© 2026 MZX MEDIA LLC. All rights reserved.