Top S&P 500 YTD Returns
Year-to-date performance of every S&P 500 constituent, updated daily
AS OF NOV 02, 2026
Which S&P 500 stock has performed best this year? This page ranks every S&P 500 constituent by its year-to-date (YTD) return in 2026: from the biggest YTD gainers to the steepest losers. Refreshed every morning, the S&P 500 YTD leaderboard always reflects the latest prices, so you can see the best performing stocks year to date at a glance.
Today's Editor's Notes
Read the full notes →Monday, November 02, 2026
18 earnings reports today, 11 after the close. Howmet Aerospace leads the picks (+6.9% this month); Consumer Discretionary is the day's leading sector.
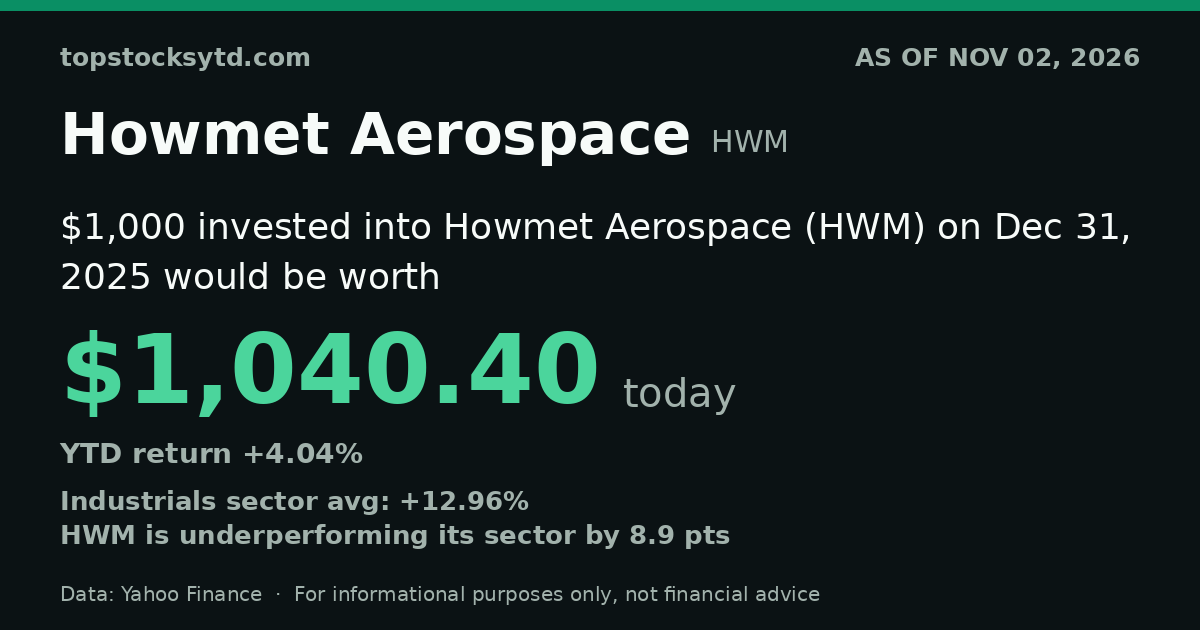
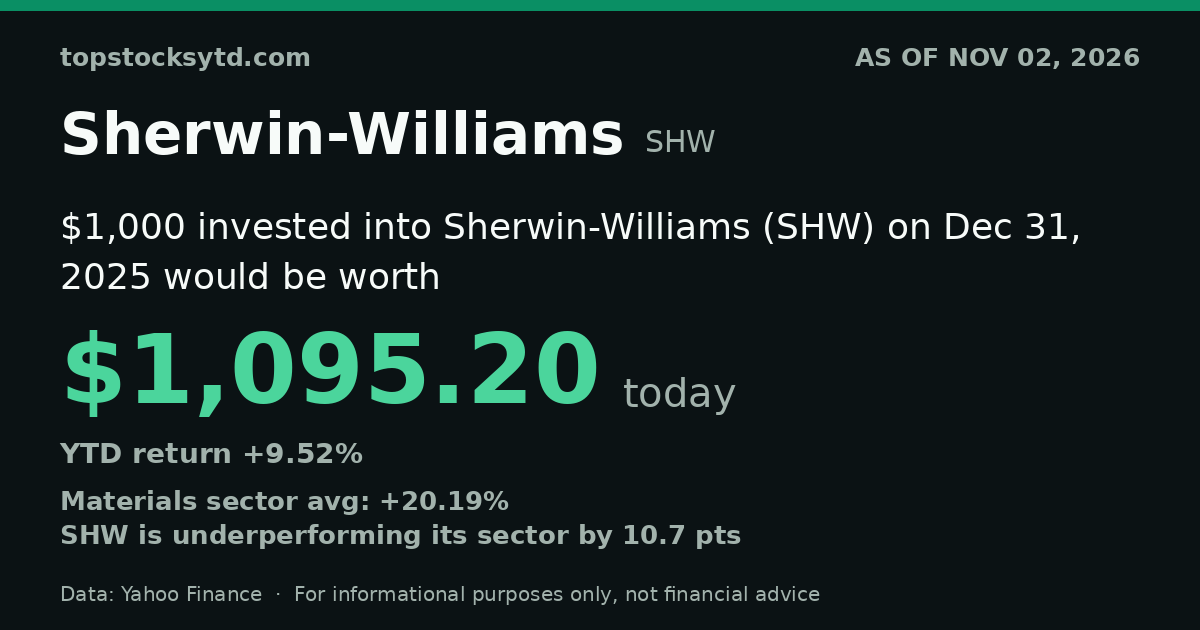
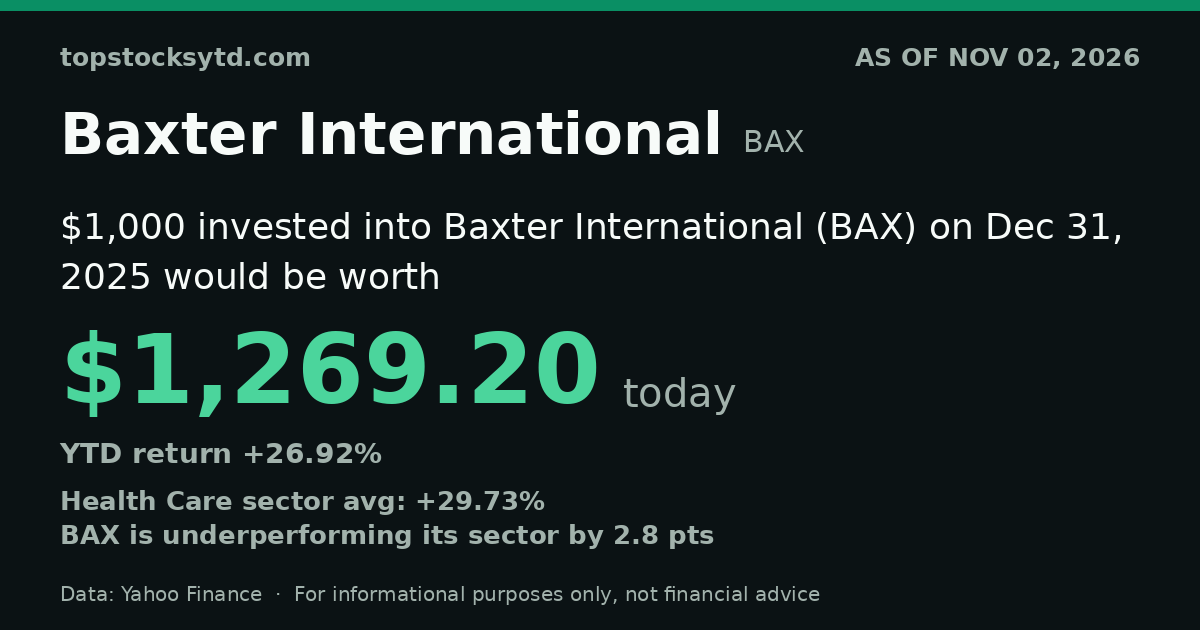
Picks are mechanical, from recent momentum among stocks positive on the year. Not financial advice. Read the full notes →
Top of the week
Biggest week-to-date gainers among ranked stocks.
| # | Asset | WTD % | YTD % | Rank change |
|---|---|---|---|---|
| 1 | Idexx Laboratories | +21.85% | -0.72% | ▲82 |
| 2 | Howmet Aerospace | +6.91% | +4.04% | ▲38 |
| 3 | Pentair | +6.49% | -31.57% | ▲4 |
| 4 | CRH plc | +6.36% | -21.74% | ▲7 |
| 5 | DoorDash | +6.19% | -16.08% | ▲11 |
| 6 | CBRE Group | +6.13% | -14.95% | ▲8 |
| 7 | Copart | +5.97% | -18.44% | ▲9 |
| 8 | Sherwin-Williams | +5.94% | +9.52% | ▲45 |
| 9 | Alexandria Real Estate Equities | +5.90% | -10.48% | ▲15 |
| 10 | TransDigm Group | +5.83% | -8.74% | ▲19 |
The week-to-date move is measured from the previous Friday's close and resets each Monday; rank change compares each stock's YTD-leaderboard rank at the week's start versus now. Rebuilt every weekday morning and after the close.
Top of the month
Biggest November gainers among ranked stocks. See every month of 2026 →
| # | Asset | MTD % | YTD % | Rank change |
|---|---|---|---|---|
| 1 | Idexx Laboratories | +21.85% | -0.72% | ▲82 |
| 2 | Howmet Aerospace | +6.91% | +4.04% | ▲38 |
| 3 | Pentair | +6.49% | -31.57% | ▲4 |
| 4 | CRH plc | +6.36% | -21.74% | ▲7 |
| 5 | DoorDash | +6.19% | -16.08% | ▲11 |
| 6 | CBRE Group | +6.13% | -14.95% | ▲8 |
| 7 | Copart | +5.97% | -18.44% | ▲9 |
| 8 | Sherwin-Williams | +5.94% | +9.52% | ▲45 |
| 9 | Alexandria Real Estate Equities | +5.90% | -10.48% | ▲15 |
| 10 | TransDigm Group | +5.83% | -8.74% | ▲19 |
The month-to-date move is measured from the last close before the 1st and resets each month; rank change compares each stock's YTD-leaderboard rank at the month's start versus now. Rebuilt every weekday morning and after the close.
| Rank | Company | Ticker | Price | YTD Return |
|---|---|---|---|---|
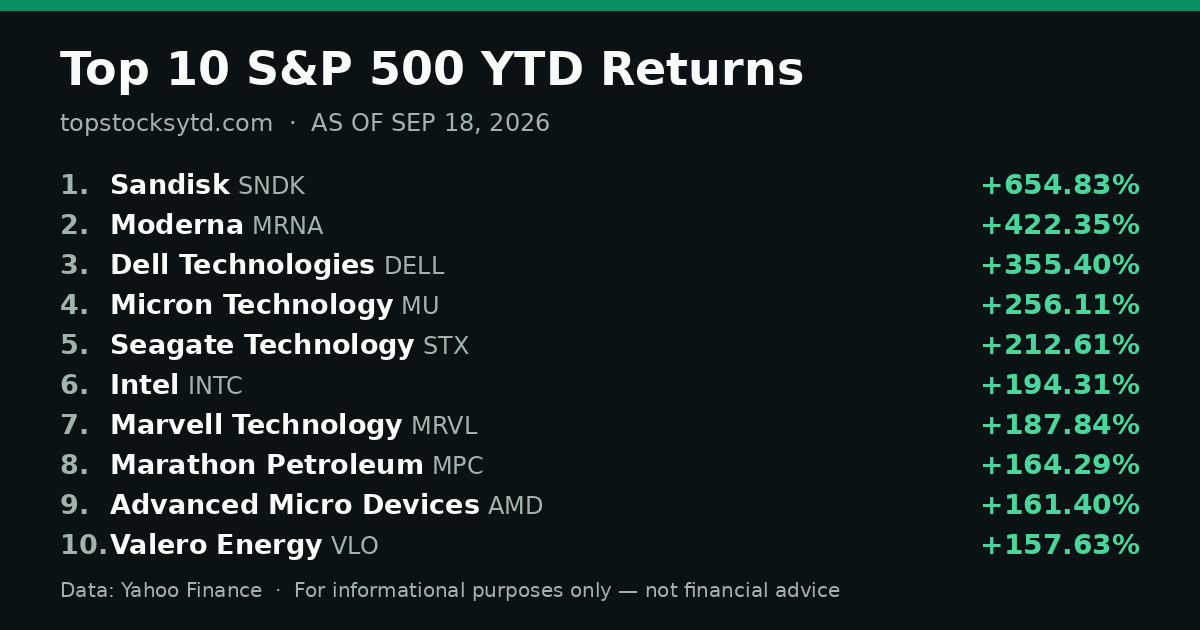
| 1 | Moderna | MRNA | $220.83 | +648.83% |
| 2 | Sandisk | SNDK | $1,075.08 | +352.89% |
| 3 | Dell Technologies | DELL | $392.78 | +214.88% |
| 4 | Micron Technology | MU | $833.59 | +192.24% |
| 5 | Marathon Petroleum | MPC | $430.39 | +167.72% |
| 6 | Valero Energy | VLO | $381.46 | +137.80% |
| 7 | Bloom Energy | BE | $196.25 | +125.86% |
| 8 | Advanced Micro Devices | AMD | $466.84 | +117.99% |
| 9 | Phillips 66 | PSX | $275.04 | +117.60% |
| 10 | Seagate Technology | STX | $593.76 | +116.14% |
| 11 | Hewlett Packard Enterprise | HPE | $51.19 | +115.66% |
| 12 | CrowdStrike | CRWD | $241.81 | +106.34% |
| 13 | APA Corporation | APA | $48.82 | +104.27% |
| 14 | Marvell Technology | MRVL | $171.41 | +102.00% |
| 15 | Western Digital | WDC | $338.59 | +96.75% |
| 16 | Palo Alto Networks | PANW | $351.72 | +90.94% |
| 17 | Lumentum | LITE | $684.40 | +85.68% |
| 18 | Texas Instruments | TXN | $302.02 | +77.01% |
| 19 | NetApp | NTAP | $185.26 | +75.26% |
| 20 | Illumina, Inc. | ILMN | $226.58 | +72.75% |
| 21 | Nucor | NUE | $277.65 | +71.22% |
| 22 | Everpure | P | $113.78 | +69.80% |
| 23 | Charles River Laboratories | CRL | $338.54 | +69.71% |
| 24 | Target Corporation | TGT | $158.38 | +66.49% |
| 25 | DaVita | DVA | $185.74 | +63.49% |
| 26 | Intel | INTC | $59.97 | +62.52% |
| 27 | Targa Resources | TRGP | $294.73 | +62.10% |
| 28 | Centene Corporation | CNC | $66.53 | +61.68% |
| 29 | Humana | HUM | $410.41 | +61.43% |
| 30 | ConocoPhillips | COP | $146.84 | +60.32% |
| 31 | LyondellBasell | LYB | $66.88 | +59.60% |
| 32 | Fortinet | FTNT | $126.21 | +58.93% |
| 33 | Datadog | DDOG | $216.10 | +58.91% |
| 34 | CF Industries | CF | $120.33 | +57.86% |
| 35 | Revvity | RVTY | $151.60 | +57.01% |
| 36 | EOG Resources | EOG | $157.89 | +54.10% |
| 37 | Chevron Corporation | CVX | $227.77 | +53.62% |
| 38 | Analog Devices | ADI | $412.85 | +53.59% |
| 39 | Viatris | VTRS | $18.67 | +53.49% |
| 40 | ExxonMobil | XOM | $179.67 | +52.30% |
| 41 | Host Hotels & Resorts | HST | $25.57 | +51.34% |
| 42 | Dow Inc. | DOW | $34.18 | +51.16% |
| 43 | Occidental Petroleum | OXY | $60.72 | +49.74% |
| 44 | Steel Dynamics | STLD | $251.91 | +49.46% |
| 45 | Best Buy | BBY | $96.14 | +49.32% |
| 46 | Zebra Technologies | ZBRA | $361.13 | +48.72% |
| 47 | West Pharmaceutical Services | WST | $407.88 | +48.59% |
| 48 | Generac | GNRC | $202.04 | +48.16% |
| 49 | Stanley Black & Decker | SWK | $106.71 | +48.08% |
| 50 | Hasbro | HAS | $118.36 | +47.63% |
| 51 | Quanta Services | PWR | $621.18 | +47.27% |
| 52 | Keysight Technologies | KEYS | $298.94 | +47.12% |
| 53 | Williams-Sonoma, Inc. | WSM | $259.45 | +46.80% |
| 54 | Quest Diagnostics | DGX | $250.81 | +46.42% |
| 55 | Applied Materials | AMAT | $374.53 | +46.26% |
| 56 | United Rentals | URI | $1,175.42 | +46.12% |
| 57 | Twilio | TWLO | $207.60 | +45.95% |
| 58 | Amgen | AMGN | $465.45 | +45.11% |
| 59 | Deere & Company | DE | $667.60 | +44.19% |
| 60 | Merck & Co. | MRK | $148.36 | +43.86% |
| 61 | CSX Corporation | CSX | $51.62 | +43.70% |
| 62 | Labcorp | LH | $355.59 | +42.79% |
| 63 | International Flavors & Fragrances | IFF | $94.63 | +42.67% |
| 64 | Iron Mountain | IRM | $115.18 | +42.04% |
| 65 | Qnity Electronics | Q | $115.37 | +41.55% |
| 66 | Biogen | BIIB | $249.01 | +41.49% |
| 67 | Corning Inc. | GLW | $123.20 | +41.45% |
| 68 | Gilead Sciences | GILD | $170.33 | +41.27% |
| 69 | Altria | MO | $77.17 | +40.32% |
| 70 | Cboe Global Markets | CBOE | $349.22 | +40.16% |
| 71 | eBay Inc. | EBAY | $120.93 | +40.12% |
| 72 | Coca-Cola Company (The) | KO | $95.83 | +39.74% |
| 73 | Flex Ltd. | FLEX | $84.20 | +39.36% |
| 74 | Travelers Companies (The) | TRV | $398.80 | +39.04% |
| 75 | Schlumberger | SLB | $52.31 | +38.53% |
| 76 | Vertiv | VRT | $224.24 | +38.51% |
| 77 | J.M. Smucker Company (The) | SJM | $131.35 | +38.43% |
| 78 | FedEx | FDX | $318.25 | +38.34% |
| 79 | Monolithic Power Systems | MPWR | $1,243.95 | +37.73% |
| 80 | Veeva Systems | VEEV | $307.00 | +37.53% |
| 81 | Nordson Corporation | NDSN | $327.58 | +37.47% |
| 82 | W. W. Grainger | GWW | $1,377.66 | +37.33% |
| 83 | Franklin Resources | BEN | $31.97 | +37.14% |
| 84 | Skyworks Solutions | SWKS | $85.17 | +37.11% |
| 85 | Garmin | GRMN | $274.29 | +36.87% |
| 86 | Corpay | CPAY | $409.29 | +36.01% |
| 87 | Lockheed Martin | LMT | $643.15 | +35.38% |
| 88 | Expeditors International | EXPD | $200.56 | +35.29% |
| 89 | Devon Energy | DVN | $48.63 | +35.27% |
| 90 | Diamondback Energy | FANG | $199.74 | +35.14% |
| 91 | Teradyne | TER | $261.01 | +35.01% |
| 92 | Marriott International | MAR | $416.30 | +34.98% |
| 93 | Wabtec | WAB | $286.79 | +34.82% |
| 94 | Union Pacific Corporation | UNP | $307.00 | +34.73% |
| 95 | Keurig Dr Pepper | KDP | $36.82 | +34.66% |
| 96 | Archer Daniels Midland | ADM | $75.77 | +34.51% |
| 97 | IDEX Corporation | IEX | $236.52 | +34.32% |
| 98 | Cisco | CSCO | $101.61 | +33.83% |
| 99 | State Street Corporation | STT | $169.31 | +33.64% |
| 100 | Masco | MAS | $83.51 | +33.37% |
Data as of November 02, 2026; YTD measured from the December 31, 2025 close (markets were closed January 1, 2026), adjusted for splits and dividends; source: Yahoo Finance. A dash indicates no usable price data.
2026 stock market snapshot
Breadth behind the year-to-date S&P 500 leaderboard, recalculated every morning.
Market breadth is broad: 349 of 500 ranked S&P 500 constituents (70%) are positive year to date. The median stock is +12.39% YTD; the median stock is ahead of the index's +10.17%. The average (+16.51%) is skewed by a handful of extreme outliers at the top of the table.
Climbing the board
The biggest YTD rank gains over the last 7 days, and the latest milestone crossings across the board.
Biggest rank climbers (7 days)
Milestones
Earnings this week
Expected earnings report dates for tracked S&P 500 stocks over the next 7 days, from the Nasdaq earnings calendar. See the full week →
Today, Monday, November 2
| Ticker | Company | Reports | EPS est. | YTD |
|---|---|---|---|---|
| ETR | Entergy | Before open | $1.71 | +21.02% |
| EL | Estée Lauder Companies (The) | Before open | $0.52 | +1.09% |
| FOXA | Fox Corporation (Class A) | Before open | $1.99 | -13.31% |
| FOX | Fox Corporation (Class B) | Before open | $2.12 | -12.92% |
| IDXX | Idexx Laboratories | Before open | $3.71 | -0.72% |
| MAR | Marriott International | Before open | $2.86 | +34.98% |
| PEG | Public Service Enterprise Group | Before open | $1.21 | -4.96% |
| AAPL | Apple Inc. | After close | $1.98 | +24.79% |
| CLX | Clorox | After close | $0.97 | -7.65% |
| FANG | Diamondback Energy | After close | $4.92 | +35.14% |
| DOC | Healthpeak Properties | After close | $0.43 | +27.19% |
| ON | ON Semiconductor | After close | $0.88 | +29.47% |
| PLTR | Palantir Technologies | After close | $0.32 | +0.33% |
| O | Realty Income | After close | $1.11 | +5.74% |
| SBAC | SBA Communications | After close | $2.89 | -2.53% |
| UDR | UDR, Inc. | After close | $0.64 | +1.46% |
| VRTX | Vertex Pharmaceuticals | After close | $4.36 | +22.01% |
| WMB | Williams Companies | After close | $0.55 | +21.04% |
Tuesday, November 3
| Ticker | Company | Reports | EPS est. | YTD |
|---|---|---|---|---|
| AME | Ametek | Before open | $2.12 | +18.36% |
| APO | Apollo Global Management | Before open | $2.04 | -16.44% |
| APTV | Aptiv | Before open | $1.33 | -41.87% |
| ADM | Archer Daniels Midland | Before open | $1.63 | +34.51% |
| BALL | Ball Corporation | Before open | $1.06 | +29.78% |
| BR | Broadridge Financial Solutions | Before open | $1.37 | -15.92% |
| DD | DuPont | Before open | $1.86 | +18.62% |
| ETN | Eaton Corporation | Before open | $3.54 | +15.89% |
| EXPD | Expeditors International | Before open | $2.24 | +35.29% |
| FISV | Fiserv | Before open | $1.72 | -22.69% |
| IT | Gartner | Before open | $2.86 | -6.75% |
| HSIC | Henry Schein | Before open | $1.34 | +14.61% |
Plus 24 more reporting Tuesday. See the full week
Wednesday, November 4
| Ticker | Company | Reports | EPS est. | YTD |
|---|---|---|---|---|
| CDW | CDW Corporation | Before open | $2.77 | +12.32% |
| COR | Cencora | Before open | $4.55 | +0.62% |
| CRL | Charles River Laboratories | Before open | $2.98 | +69.71% |
| CVS | CVS Health | Before open | $1.62 | +14.14% |
| DDOG | Datadog | Before open | $0.18 | +58.91% |
| EMR | Emerson Electric | Before open | $1.85 | +26.46% |
| FIS | Fidelity National Information Services | Before open | $1.61 | -37.66% |
| PODD | Insulet Corporation | Before open | $1.59 | -45.96% |
| KHC | Kraft Heinz | Before open | $0.43 | +8.13% |
| MLM | Martin Marietta Materials | Before open | $5.27 | -10.93% |
| MCD | McDonald's | Before open | $3.36 | -11.38% |
| Q | Qnity Electronics | Before open | $1.18 | +41.55% |
Plus 32 more reporting Wednesday. See the full week
Thursday, November 5
| Ticker | Company | Reports | EPS est. | YTD |
|---|---|---|---|---|
| APD | Air Products | Before open | $3.60 | +30.48% |
| BDX | Becton Dickinson | Before open | $4.06 | +32.70% |
| CAH | Cardinal Health | Before open | $2.92 | +24.64% |
| CI | Cigna | Before open | $7.46 | +9.07% |
| COP | ConocoPhillips | Before open | $2.95 | +60.32% |
| CMI | Cummins | Before open | $8.38 | -0.92% |
| DTE | DTE Energy | Before open | $2.22 | +7.00% |
| DUK | Duke Energy | Before open | $1.87 | +12.40% |
| EVRG | Evergy | Before open | $2.30 | +22.42% |
| GPN | Global Payments | Before open | $3.57 | +30.01% |
| IRM | Iron Mountain | Before open | $1.35 | +42.04% |
| KMB | Kimberly-Clark | Before open | $1.66 | +11.43% |
Plus 28 more reporting Thursday. See the full week
Friday, November 6
| Ticker | Company | Reports | EPS est. | YTD |
|---|---|---|---|---|
| CHTR | Charter Communications | Before open | $10.06 | -44.65% |
| BEN | Franklin Resources | Before open | $0.78 | +37.14% |
| HUM | Humana | Before open | ($1.03) | +61.43% |
| MRNA | Moderna | Before open | ($1.10) | +648.83% |
| PPL | PPL Corporation | Before open | $0.53 | +5.68% |
| VST | Vistra Corp. | Before open | $2.18 | -16.33% |
| BRK.B | Berkshire Hathaway | Time not specified | $5.91 | +10.64% |
Report dates and times are expected and can change. EPS figures are analyst consensus estimates from Nasdaq.
For informational purposes only, not financial advice. How we calculate YTD returns
About · Contact · Privacy Policy · Affiliate Disclosure
© 2026 MZX MEDIA LLC. All rights reserved.
S&P 500 YTD FAQ
What is the best performing S&P 500 stock YTD in 2026?
As of November 02, 2026, Moderna (MRNA) is the best performing S&P 500 stock year to date, up +648.83% since December 31, 2025. The ranking above tracks year-to-date returns for every S&P 500 constituent and is updated daily.
What does YTD mean in stocks?
YTD stands for year-to-date. A stock YTD return measures how much a stock's price has changed from the start of the current year to today, expressed as a percentage. US markets were closed on January 1, 2026 (New Year's Day), so this page measures YTD from the December 31, 2025 close.
How is stock YTD return calculated?
YTD return equals the latest closing price divided by the December 31, 2025 closing price, minus 1, times 100, adjusted for stock splits and dividends. For example, a stock that closed at $100 on December 31, 2025 and trades at $150 today has a +50% YTD return. See the full methodology for data sources and limitations.
Which stocks are included in the S&P 500 YTD ranking?
The ranking covers every S&P 500 constituent, ordered by their year-to-date return in 2026, from the biggest gainers to the biggest losers. Currently leading: Moderna (MRNA), Sandisk (SNDK), Dell Technologies (DELL).
How often is the S&P 500 YTD ranking updated?
The ranking refreshes every morning with the latest market prices, so the S&P 500 YTD leaderboard always reflects the most recent data.
What is the worst performing S&P 500 stock YTD in 2026?
As of November 02, 2026, AppLovin (APP) is the worst performing S&P 500 stock year to date in 2026, with a YTD return of -66.04% since the December 31, 2025 close. The full ranking on this page covers every S&P 500 constituent, from the biggest gainers to the biggest losers.
How often are stock YTD returns updated?
Stock YTD returns on Top Stocks YTD are updated twice each weekday (once before the market opens and once after the close), so the rankings always reflect the latest closing prices.
Which S&P 500 sector is performing best YTD in 2026?
As of November 02, 2026, Energy is the best performing S&P 500 sector year to date in 2026, with an average YTD return of +51.69% across its 21 constituents.